
My evergreen reminder why I track net yards per play here at ze blog:
As a general rule of thumb based on the last four seasons, you’d better create a net YPP of 2+ if you want a realistic shot at the CFP (the four-team version, that is). And if you want to win, you’d better wind up north of 2.5. It doesn’t matter how you get there — track Alabama’s numbers over those four years, for example — just that you do get there.
This is why I like net YPP best, when it comes to advanced stats. It may not be perfect, but it’s relatively easy to understand and it’s a good judge of a team’s overall quality.
Or, to put it another way, here’s a chart from Josh:
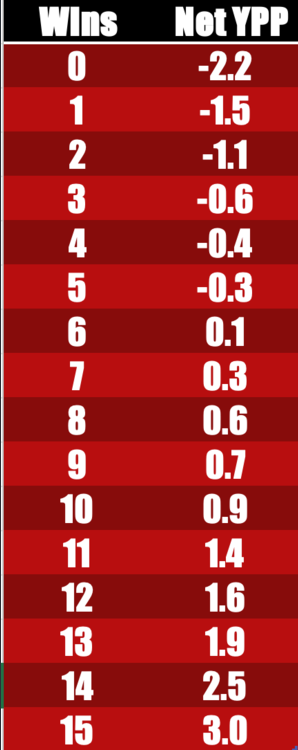
In other words, you can’t win if you don’t net yards per play.


LikeLiked by 7 people
Net YPP is the ultimate predictor. Teams that generate yards generally produce points (or at least, flip field position). Teams that limit yards also generally limit points (especially in the red zone) and create field position. Teams that can do both are hard to beat without turnover help (see Florida 2021).
LikeLike
Agreed and I think field position is an underrated stat as well. 2021 UGA offense rarely if ever went 3 and out against anyone. Not only was the defense lights out, other teams were often in the shadow of their goal posts to start drives.
LikeLiked by 1 person
Yep and Jake Camarda was a serious field position weapon when we did have to punt (he may have been the MVP of the Clemson game) and on kickoffs. He’s likely going to make a lot of low risk money as a punter on Sundays.
LikeLiked by 1 person
He may have been MVP for the whole year.
LikeLike
Back in the early 90’s our usual remark at games was “thank GOD for our punter,” but not for the same reason as above, as this was usually followed by “nice kick, thunderfoot!”
LikeLike
There’s no question that YPP is valid, but it isn’t a predictor. Rather, it is an after the fact explanation. So, it’s kind of useless until the season is over. It’s a bit like saying if you want to be the richest person you have to have the most money. Now just go do it. Tell me this: what is our YPP going to be next season, and show your work for how we get there.
LikeLiked by 2 people
Point taken but take 2 teams net YPP and put them up against each other. I would bet it’s a strong predictor of what happens between them.
LikeLiked by 1 person
Also a good point in that it will tell you if the two teams are in the same general neighborhood, but it won’t tell you much about if the better YPP in the forthcoming game will be a winner. What was UGA’s YPP going in to SECCG v. Bama? Then compare those two teams before and after the Final game. Was one a predictor of the other? I’m too lazy to find out, but I am going to predict that our YPP was better than Bama’s going into the SECCG (how could it not be? We played a much easier schedule and had more success) so that wouldn’t seem like much of a useful predictor.
LikeLike
It seems to be a good measure of complementary football which is an indicator of general team strength. Of course, there’s an any given Saturday aspect of it.
LikeLike
Yep. To me “complementary football” = team football. Offense + defense + special teams. You need to have all three working to be in the hunt.
LikeLike
First, steal underpants…
LikeLiked by 1 person
I thought the key to success was Metchie and Williams.
LikeLiked by 7 people
Senator, your evolution from quoting Bill C’s analytics to YPP makes for a better blog! YPP is so valuable analytically because it boils the game down to its essence. “What happens when teams run a play?” And when one does “back of the envelope” math, it makes even more sense. If there are 150 plays a game and a team is gaining a 2 yard advantage per play, they are going to outgain their opponents by 300 yards. If we assume the average TD drive requires somewhere between 60-80, that is anywhere from a 3 – 5 TD advantage, assuming turnovers, missed FGs and STs don’t highjack things…..
The only thing it doesn’t capture is who you achieve that YPP against, which is my biggest gripe about how stats are presented. They also treat G5 and P5 the same. While the information value is the same, it is obviously absurd when they are comingled.
LikeLike
Everyone’s schedules are generally the same.
8-9 conference games
1-2 Power 5 OOC
2-3 cupcakes including FCS
You could opponent adjust the results , but I don’t think it would change the results dramatically.
LikeLike
Right, but the G5 conference games are significantly easier than P5. The YPP that a G5 team achieves isn’t the same as a P5.
LikeLike
That’s totally fair, but I would also say a Group of 5 team with a strong net YPP metric has a higher likelihood of beating a Power 5 with a lousy YPP metric. As I mentioned, it’s a good metric for the degree of complementary football a team plays. If Kent State had a better YPP compared to Georgia, I still wouldn’t predict them to win straight up. It is a very good measure especially for teams in the same conference or the same strata.
LikeLike